Introduction
This 5th fortnight we learned about Data and Network. From classification, the unstructured to structured data, followed by the discussion of creating the cohort standard and protocols as the input for the homework that we will share as a cohort, to finally we did the data sharing activity using the tools given (rope, cups, sticks and post-it notes). We classified the data based on the materials as we all agreed, but then there were trade-offs in making sense when we did the data sharing activity using the network of ropes that we built.
The Process
For this fortnight 5 homework, we were asked to pick one of the ACT Open Data Portal datasets, and I selected the ACT population born overseas dataset. Then I performed an exploratory analysis of that dataset using Tableau, which explained in the short video below.
We also created and partially implemented a standard that we defined together as a cohort, but our standard is still in working progress and requires more updates in future due to time constraints. The draft standard and my contribution to the standard can be found on the link below.
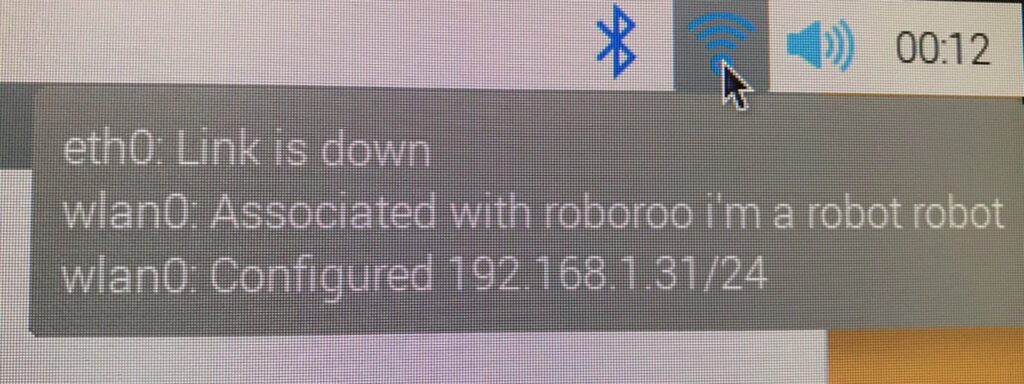
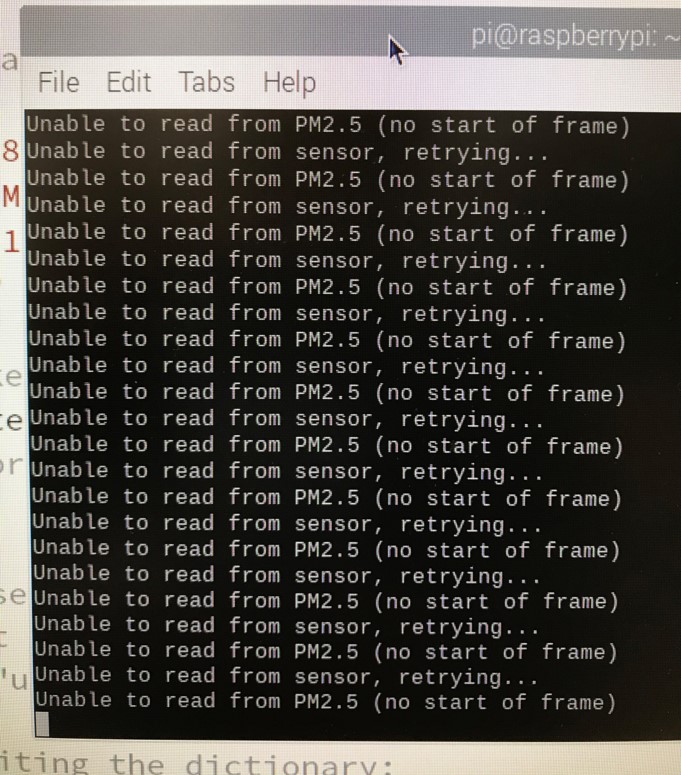
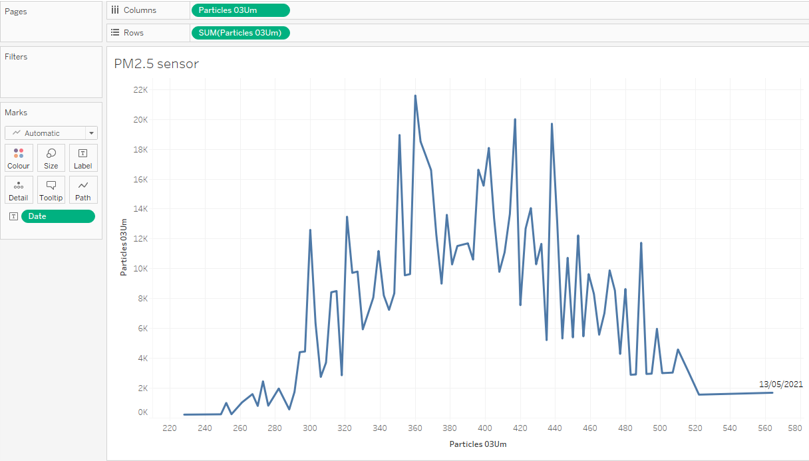
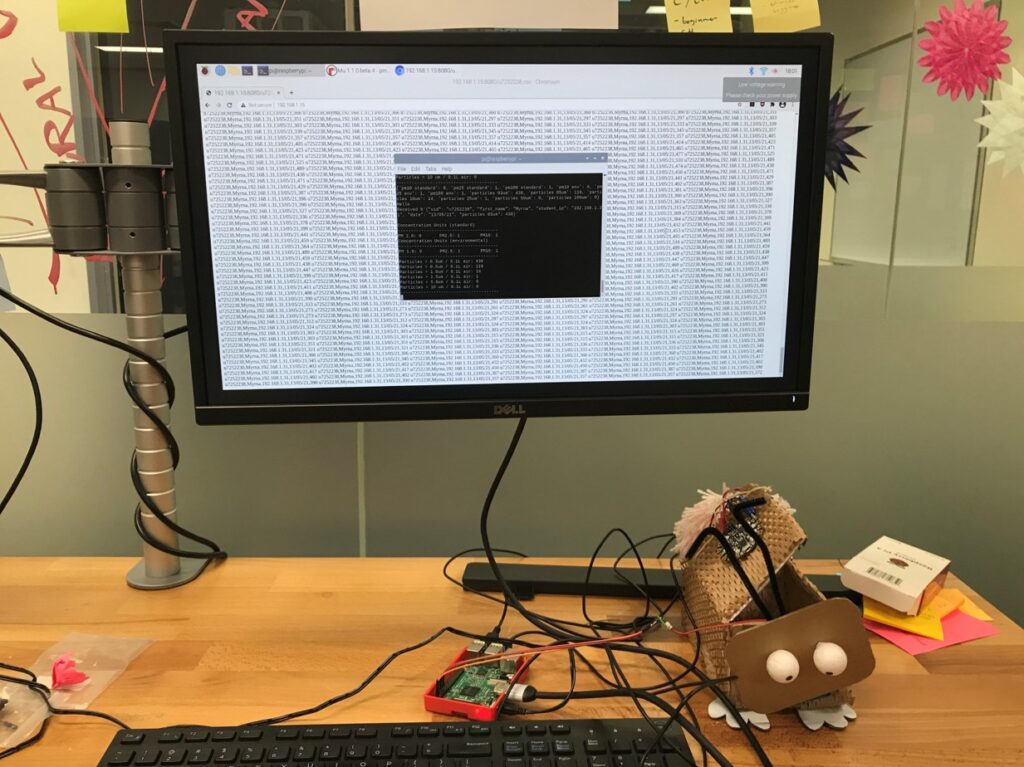
Lastly, we had to build and connect our Raspberry Pi to the PM2.5 air quality sensor to create a networked sensing system. The Tableau chart, the code, and the reading log for the PM2.5 air quality sensor are shown below.
I have used Tableau before, when I started my analytics role last year, so I’m comfortable with data wrangling using basic Tableau functions and capabilities. And I think my previous role as a data analyst has made me have a different approach that may have influenced the data analysis process and outcomes compared to the other cohort. But I have never used the PM2.5 air quality sensor nor the Raspberry Pi. So I had few technical challenges setting up both of them initially, so did Chloe as we did it together. Then, with the help from Matthew (tutor), we managed to set up the Raspberry Pi finally.
There was some minor error in the instruction provided hence why we couldn’t connect to the network in the studio. Nevertheless, we shared our findings and helped the rest of the cohort set up their Raspberry Pi. Unfortunately, I had to swap the PM2.5 sensor with Chloe because it didn’t work with her raspberry Pi but somehow worked with mine. Only later on, it didn’t work with mine either because it was a faulty sensor, but due to the unavailability of the spare sensor, I had to use Sarah’s cute creature in the last couple of days.
Reflection
I collaborate and work with other people to overcome my challenges and help others where I can, as we’re all in this journey together, and we learn from and complement each other skills. That’s what makes this cohort is so wholesome. Together, we can learn more and achieve a much better outcome. This collaboration learning and teamwork skill development is essential for the future of NBE practitioners.
One of the feedbacks that I received from this homework is how my reflection can be improved by contextualising and connecting my experience during the homework to the relevance of data wrangling to the NBE. By this fortnight, my reflective practice had improved compared to when I started this year, and I’m planning to continue this good habit. And this is my further reflection on Data & Network in Q&A style from the exercise in Tableau this fortnight.
Acknowledgement
Matthew (tutor), who helped me to set up the Raspberry Pi and connect to the Wi-Fi network.
Chloe who shared her experience in setting up the Raspberry Pi and PM2.5 air quality sensor.
Sarah who kindly letting me to borrow her PM2.5 air quality sensor on the cute Beetle creature.
Johan who helped me reset the router when it was down and I couldn’t connect to the network to log the reading from PM2.5 air quality sensor.